PowerPoint presentation on the building blocks and features of the environment data portals.
PowerPoint presentation with tips on good practices, when uploading data to the environment data portals.
The World Database on Protected Areas (WDPA) is the most comprehensive global database of marine and terrestrial protected areas, updated on a monthly basis, and is one of the key global biodiversity data sets being widely used by scientists, businesses, governments, International secretariats and others to inform planning, policy decisions and management.
End of Internship presentation on Pacific Climate Finance. Section are: climate finance challenges, overview of climate finance in the Pacific, and next steps.
End of SPREP internship presentation, July 2015. Sections: climate finance challenges, overview of climate finance in the Pacific, and next steps.
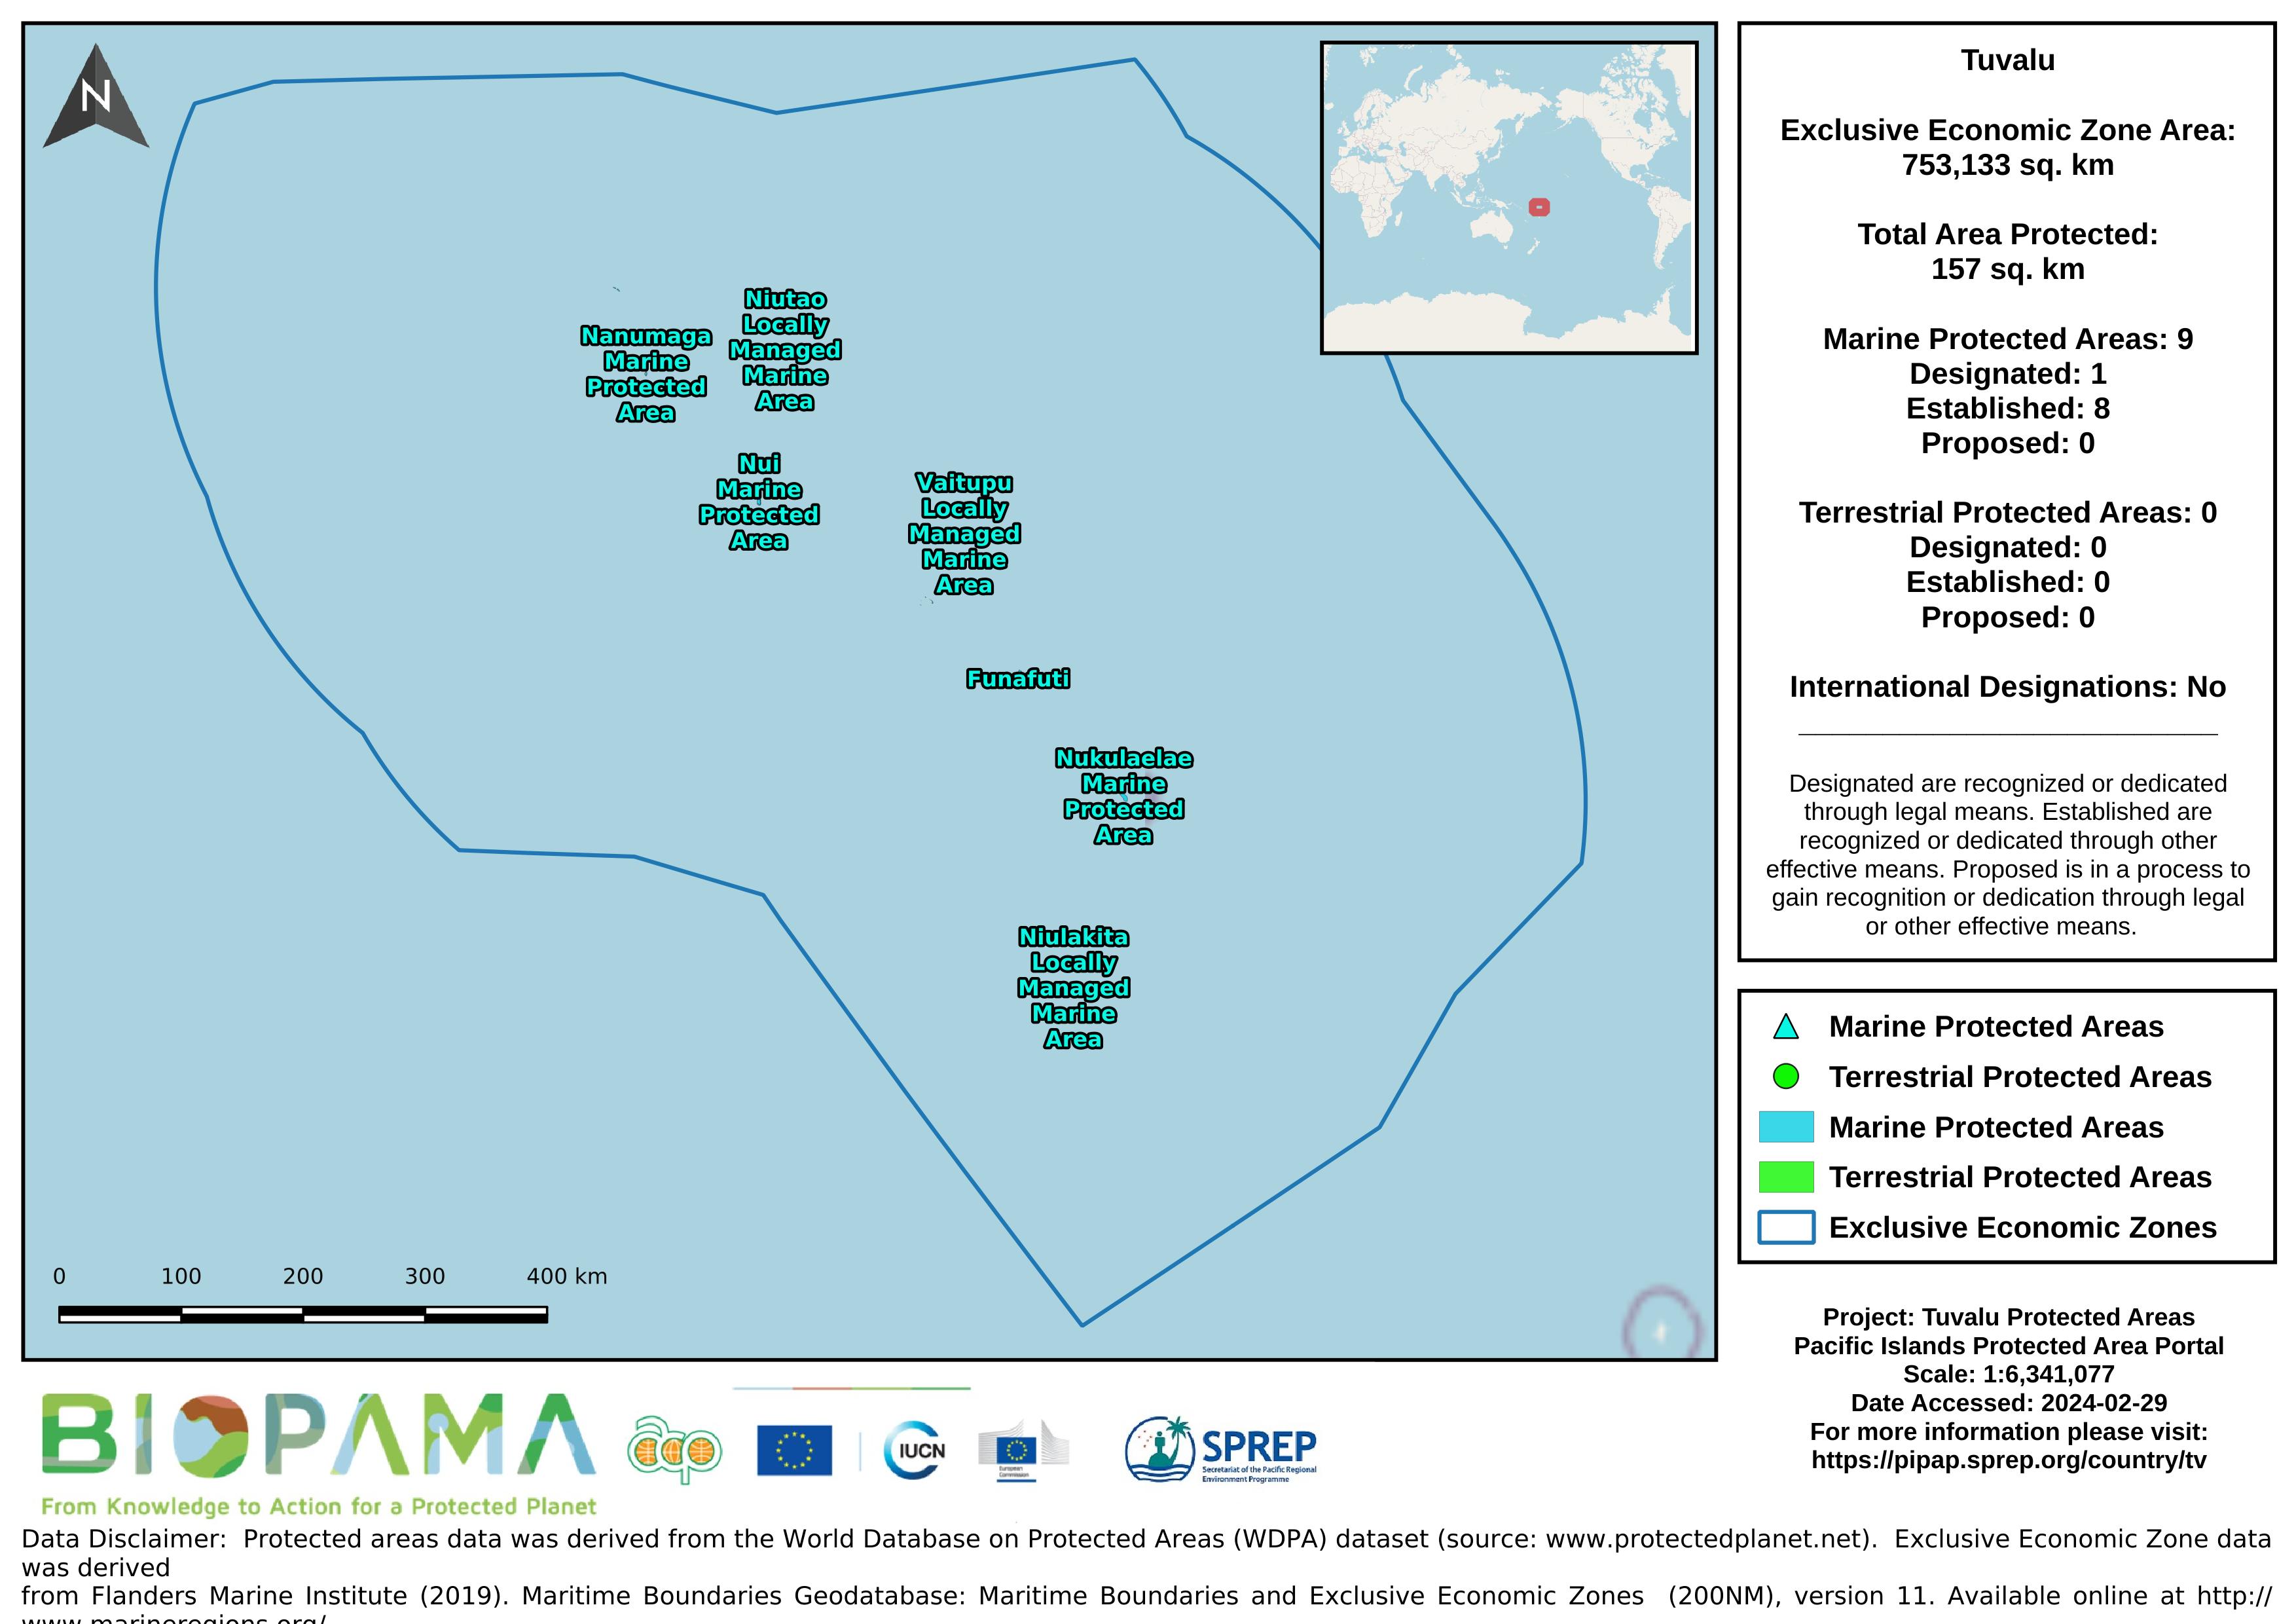
Map of the protected areas for Tuvalu with country-level summary statistics on the amount of area under protection, count for each type of protected area (terrestrial or marine), and the count of their designation.
A direct internet link to and resources pertaining the Blue Habitat website which has been established as a portal for information on the global distribution of marine ‘blue’ habitats. Knowledge on the distribution of blue habitats is an important input into ocean management, marine spatial planning and biodiversity conservation.
Dataset regarding 'Seamounts' - peaks that rise over 1,000 m above the seafloor. Seamount chains occur in all three major ocean basins, with the Pacific having the most number and most extensive seamount chains.
a mapping representation of active and passive continental margins, oceanic plate boundaries and mid ocean spreading ridges
statistical records as of 2014 on the distribution of seamount. Accordingly, there are more seamounts in the Pacific Ocean than in the Atlantic, and their distribution can be described as comprising several elongate chains of seamounts superimposed on a more or less random background distribution (Craig and Sandwell)
A collection of Inform project training materials. You are free to download and use any of the training resources below. The PowerPoint presentations contain a complete set of slides, so please feel free to copy, delete or change slides, to fit the purpose of your country training.
Bio-ORACLE is a set of GIS rasters providing geophysical, biotic and environmental data for surface and benthic marine realms. The data are available for global-scale applications at a spatial resolution of 5 arcmin (approximately 9.2 km at the equator).
Linking biodiversity occurrence data to the physical and biotic environment provides a framework to formulate hypotheses about the ecological processes governing spatial and temporal patterns in biodiversity, which can be useful for marine ecosystem management and conservation.
Raster data representing the mean levels of calcite in µmol/m3 for the surface water layer. The data are available for global-scale applications at a spatial resolution of 5 arcmin (approximately 9.2 km at the equator).
Marine data layers for present conditions were produced with climate data describing monthly averages for the period 2000–2014, obtained from pre-processed global ocean re-analyses combining satellite and in situ observations at regular two- and three-dimensional spatial grids.
Raster data representing the mean levels of current velocities in meters/second for the surface water layer. The data are available for global-scale applications at a spatial resolution of 5 arcmin (approximately 9.2 km at the equator).
Marine data layers for present conditions were produced with climate data describing monthly averages for the period 2000–2014, obtained from pre-processed global ocean re-analyses combining satellite and in situ observations at regular two- and three-dimensional spatial grids.
Raster data representing the mean levels of iron in µmol/m3 for the surface water layer. The data are available for global-scale applications at a spatial resolution of 5 arcmin (approximately 9.2 km at the equator).
Marine data layers for present conditions were produced with climate data describing monthly averages for the period 2000–2014, obtained from pre-processed global ocean re-analyses combining satellite and in situ observations at regular two- and three-dimensional spatial grids.
Raster data representing the mean levels of pH for the surface water layer. The data are available for global-scale applications at a spatial resolution of 5 arcmin (approximately 9.2 km at the equator).
Marine data layers for present conditions were produced with climate data describing monthly averages for the period 2000–2014, obtained from pre-processed global ocean re-analyses combining satellite and in situ observations at regular two- and three-dimensional spatial grids.
Raster data representing the mean levels of photosynthetically active radiation (PAR) in E/m2/year for the surface water layer. The data are available for global-scale applications at a spatial resolution of 5 arcmin (approximately 9.2 km at the equator).
Marine data layers for present conditions were produced with climate data describing monthly averages for the period 2000–2014, obtained from pre-processed global ocean re-analyses combining satellite and in situ observations at regular two- and three-dimensional spatial grids.
From the Turtle Research and Monitoring Database System (TREDS)
From the Turtle Research and Monitoring Database System (TREDS)